

Week Ahead Overview: Navigating the Geopolitical Fire and the FOMC Pivot Point
The week of March 16, 2026, shapes up to be one of the most consequential macro weeks of the first quarter. Three concurrent macro shocks are converging on the markets: the ongoing Iran-US conflict and the closure of the Strait of Hormuz keeping Brent crude oil above $100 per barrel, a critical Federal Open Market Committee (FOMC) meeting with an updated dot-plot, and a slew of other central bank decisions including the Bank of England and the Reserve Bank of Australia. The S&P 500 has shed 1.6% over the past week, nursing a three-week consecutive losing streak, while the Nasdaq 100 has pulled back more than 15% from its February peak. Elevated volatility, with the VIX hovering near 27, signals continued market stress.
Market sentiment remains deeply cautious, driven by stagflation fears. The recent surge in oil prices — WTI crude surged 35% in a single week — has complicated the inflation outlook. While February's US Consumer Price Index (CPI) came in at 2.4% year-over-year, that reading predates the full impact of the oil shock. Economists are now warning that CPI could breach 3.5% to 4.0% by the second quarter if the Strait of Hormuz remains closed. This places the Federal Reserve in a precarious policy trap: facing an inflation problem it cannot easily cut rates through, and a growth problem it cannot hike rates through. Consequently, equity distribution has been broad-based, with investors seeking relative safe havens such as the energy-heavy FTSE 100, which has outperformed US indices.

Economic Calendar: The Fed Takes Center Stage
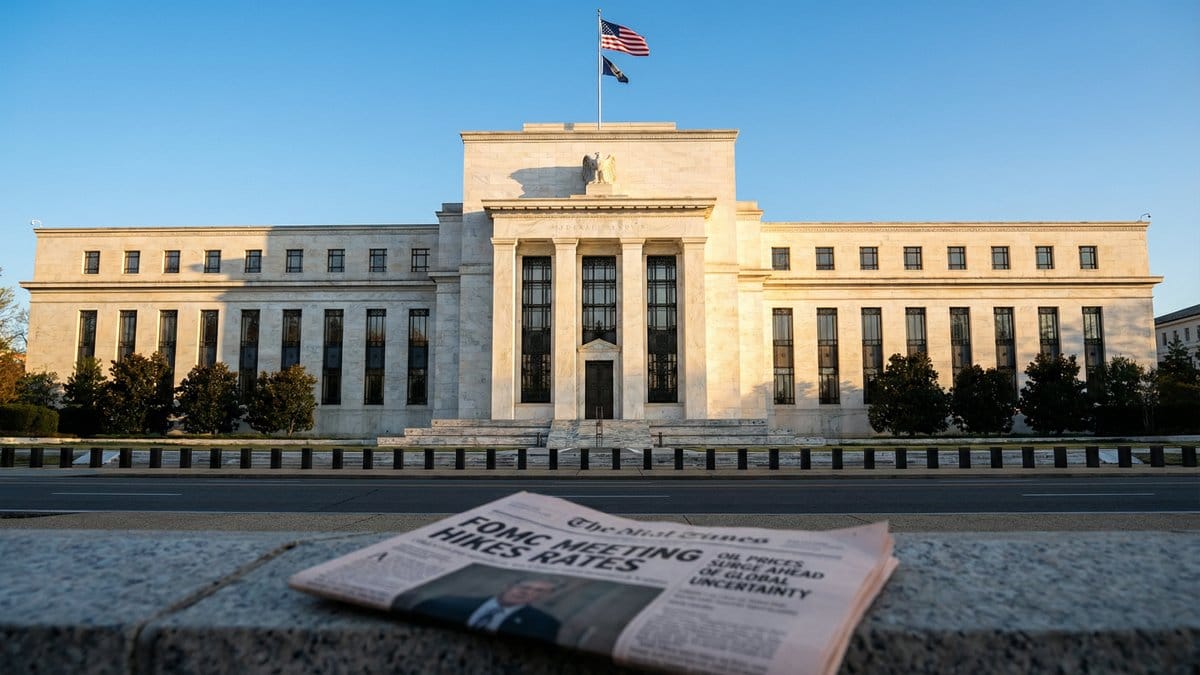
The economic calendar for the week is dominated by central bank activity, most notably the Federal Reserve's two-day meeting concluding on Wednesday, March 18. The rate decision itself is widely expected to be a hold, keeping the federal funds rate steady at 3.50% to 3.75%. However, the market's focus will be entirely on the updated Summary of Economic Projections (SEP), specifically the “dot plot,” and Chair Jerome Powell's subsequent press conference. With over 92% probability of a hold priced in by CME FedWatch, the decision itself will not be the catalyst — the dot plot and Powell's tone will be.
If the median projection shifts from one 25-basis-point cut to zero cuts in 2026, markets could experience a sharp selloff in both equities and bonds. Conversely, if the dot plot shifts to two cuts amid war-related growth concerns, risk assets might see an aggressive bounce. Powell's language regarding “geopolitical risks to the inflation outlook” will be parsed meticulously by investors. Other notable US data releases include Retail Sales and Industrial Production on Tuesday, and Housing Starts on Wednesday. Regional manufacturing gauges — the Empire State Manufacturing Index on Monday and the Philadelphia Fed Manufacturing Index on Thursday — will offer timely reads on industrial activity.
Globally, the Bank of England (BoE) will announce its rate decision on Thursday, March 19, with expectations leaning toward a hold at 4.50%, though the vote split will be closely watched. The Reserve Bank of Australia (RBA) and the Bank of Japan (BOJ) also have key events scheduled, adding to the week's macro complexity. Friday brings the quarterly triple witching options expiration, which could amplify intraday volatility.
Investment implications: Given the extraordinary macro backdrop and the high probability of volatility surrounding the FOMC decision, investors should consider reducing position sizes and widening stop losses ahead of Wednesday afternoon. The uncertainty regarding the Fed's path forward in the face of an oil shock suggests that holding large, unhedged positions carries significant risk. A defensive posture is warranted until the Fed's updated dot plot provides clearer directional guidance.
Earnings Season Focus: Tech and Retail in the Spotlight
While macroeconomic factors dominate the headlines, corporate earnings will also provide critical insights into the health of the economy and specific sectors. The week features reports from major players across technology, retail, and logistics. Micron Technology (MU) is a standout, reporting on Wednesday, March 18. The company is positioned at the center of the AI infrastructure buildout, with its High Bandwidth Memory (HBM) production pre-sold under locked price-and-volume contracts. Guidance for Q2 revenue of approximately $18.7 billion and strong non-GAAP gross margins implies a profit supercycle that consensus estimates may have structurally underpriced. With 70 buy ratings among Wall Street analysts and a consensus price target near $383, Micron represents a potential valuation re-rating opportunity if guidance is confirmed or raised.
Other key earnings include Alibaba (BABA) and FedEx (FDX) on Thursday, March 19, and lululemon (LULU) on Tuesday, March 17. FedEx's report will be closely scrutinized for commentary on global shipping volumes and supply chain disruptions, particularly in light of the Middle East conflict. Alibaba's results will offer a window into the Chinese consumer and the broader Asian economic recovery. Retailers like Dollar Tree (DLTR) on Monday and General Mills (GIS) on Wednesday will provide further color on consumer spending habits amid persistent inflation and economic uncertainty. Accenture (ACN) on Thursday will be watched for insights into enterprise technology spending trends.
Investment implications: The divergence between macroeconomic fears and strong corporate fundamentals, particularly in the AI sector, creates selective opportunities. Companies like Micron, with structural tailwinds from the HBM supercycle and deep valuation discounts relative to the broader tech sector, may offer resilience. However, investors must weigh company-specific strengths against overarching geopolitical and interest rate risks. Sector rotation toward energy and defensive names may continue if the tech sector fails to deliver robust forward guidance in the face of macro headwinds.
Geopolitical & Policy Watch: The Hormuz Chokepoint
The geopolitical landscape is currently the primary driver of market volatility. The ongoing conflict involving the United States, Israel, and Iran, and the resulting closure of the Strait of Hormuz, have created a historic oil shock. The Strait of Hormuz is a critical chokepoint for global energy supplies, and its continued closure acts as a weapon of economic pressure, keeping Brent crude firmly above the $100 mark — a level not seen since August 2022. This development has effectively neutralized the impact of emergency oil releases, such as the IEA's recent 400 million barrel deployment.
The geopolitical premium embedded in energy prices is feeding directly into stagflation fears, complicating central bank policies globally. Separately, the upcoming meeting between Chinese Vice Premier He Lifeng and US Treasury Secretary Scott Bessent in France adds another layer of policy watch, as trade relations between the two superpowers remain a critical factor for global economic stability. Any escalation in the Middle East or deterioration in US-China trade relations could trigger further risk-off sentiment across global markets and add to the pressure on equities already navigating a challenging technical environment.
Technical & Sentiment Indicators: Testing Critical Support
From a technical perspective, the major US indices are at a critical juncture. The S&P 500 is facing an imminent test of its 200-day Simple Moving Average (SMA), currently situated around 6,582. This level has remained unbroken since May 2025 and serves as the market's key line of defense for 2026. A daily close below this level on strong volume would be a major bearish signal, historically preceding average drawdowns of 8% to 12% over four to eight weeks. Immediate resistance is found between 6,680 and 6,720, with the 50-day SMA at approximately 6,856 acting as a more formidable overhead barrier.
The Nasdaq 100 has already entered a confirmed intermediate-term downtrend, having broken below its 200-day MA after surrendering more than 15% from its February peak above 25,500. It faces formidable overhead resistance at the 22,000 to 22,200 level. Market sentiment, as measured by the CNN Fear & Greed Index, has moved deeply into the “extreme fear” zone, with the VIX elevated near 27.28. While oversold conditions on the RSI (approximately 32 for the S&P 500 and 38 for the Nasdaq 100) might prompt short-covering bounces, the prevailing trend remains bearish. Investors are advised to respect the downward momentum until confirmed reversal signals materialize — most notably, a successful high-volume defense of the S&P 500's 200-day SMA accompanied by a bullish candlestick formation.
Disclaimer: This analysis is for informational and educational purposes only and should not be considered financial advice. Market forecasts are inherently uncertain, and actual events may differ materially from expectations. Always conduct your own research and consult with a qualified financial advisor before making investment decisions.