

The Bureau of Labor Statistics releases the March 2026 Producer Price Index (PPI) report at 8:30 AM ET this morning — and it may be one of the most consequential inflation readings of the year. Coming on the heels of last week's hot CPI print showing consumer prices up 3.3% year-over-year, today's PPI data will reveal how deeply the Iran war-driven oil shock has penetrated the upstream production pipeline, and what that means for the Federal Reserve's path forward on interest rates.
What Is the PPI and Why Does It Matter?
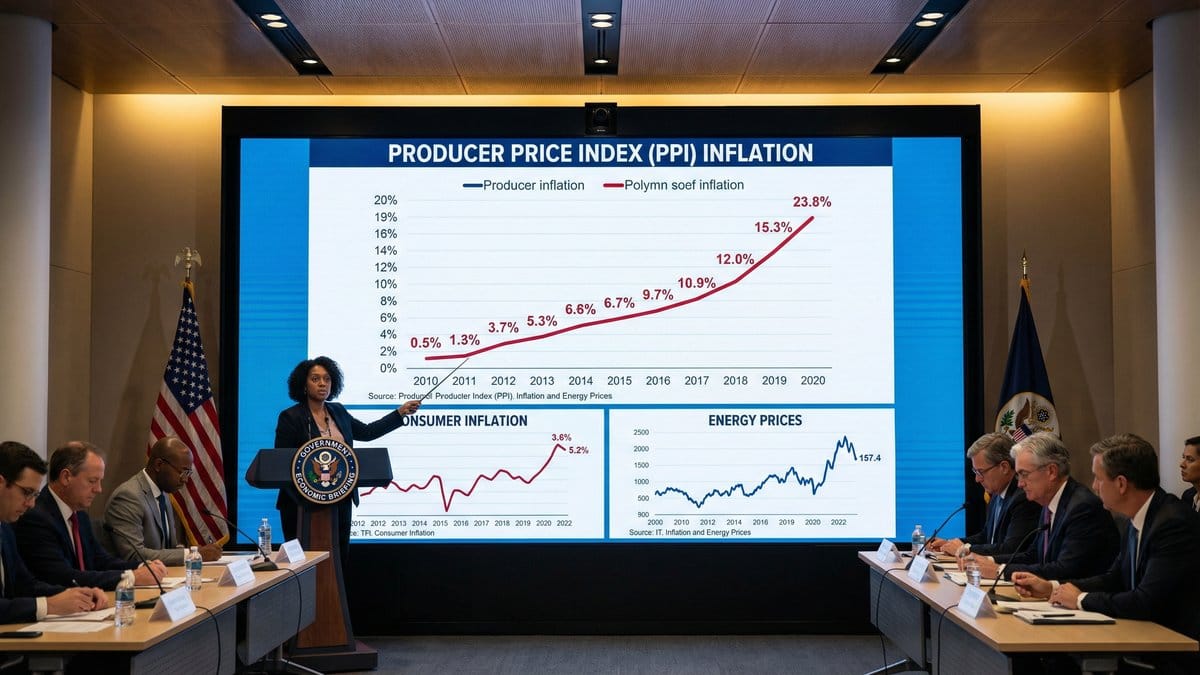
The Producer Price Index measures the average change in selling prices received by domestic producers for their output. Unlike the Consumer Price Index (CPI), which tracks what consumers pay, the PPI captures price changes at the wholesale level — before goods reach store shelves. This makes it a critical leading indicator: when producer prices rise, those costs typically flow through to consumers within weeks or months, foreshadowing future CPI increases.
For investors, the PPI matters because it directly influences corporate profit margins, shapes Federal Reserve policy expectations, and signals whether the current inflation cycle is deepening or stabilizing. A hotter-than-expected PPI reading today could further push back the timeline for Fed rate cuts — and rattle equity markets that have been hoping for monetary relief later this year.
What the Market Expects
| Metric | Previous (Feb 2026) | Forecast (Mar 2026) |
|---|---|---|
| Headline PPI (YoY) | 3.4% | 4.6% |
| Core PPI (YoY, ex-food & energy) | ~3.1% | 4.1–4.2% |
| Headline PPI (MoM) | 0.7% | +1.2% |
If the headline PPI comes in at the forecast 4.6% year-over-year, it would mark the highest annual producer price increase in more than three years. The primary driver is energy: gasoline prices surged 21.2% in a single month as the Strait of Hormuz blockade choked off approximately 20–30% of global crude oil supply. The energy component of the PPI is expected to have soared 12.5% year-over-year.
The Iran War's Fingerprints on Producer Prices
The U.S.-Iran conflict, now in its fourth week, has fundamentally disrupted global energy supply chains. With the Strait of Hormuz effectively closed, oil prices have surged above $110 per barrel — a level that ripples through virtually every sector of the economy. Manufacturing input costs have spiked as steel, aluminum, and plastics prices climb. The ISM Manufacturing Price Index surged to 78.3 in March, its highest level since June 2022, as businesses explicitly cited rising oil and fuel costs as the primary reason for price hikes.
The transmission from upstream to midstream is already visible. Automobile manufacturing — heavily dependent on steel, aluminum, and plastics — has seen new vehicle prices rise sharply, indirectly boosting the used-car market to near three-year highs. Rising fertilizer costs, themselves a product of higher natural gas prices, have kept food prices elevated. The U.S. services price index has climbed to 70.7%, its highest level since October 2022.
What a Hot PPI Means for the Federal Reserve
The Federal Reserve is currently holding rates at 3.5–3.75%, and today's PPI reading will be closely scrutinized for signals about the path forward. After February's PPI came in at 3.4% year-over-year — already above expectations — interest rate futures markets essentially ruled out a rate cut in the first half of 2026. A March reading above 4% would further reinforce that view, and could push expectations for any rate cut well into 2027.
Fed Chair Jerome Powell has stated clearly that there will be no rate cuts without meaningful progress on inflation. More ominously, some Fed officials have begun discussing the possibility of rate hikes if energy-driven inflation proves persistent. Chicago Fed President Austan Goolsbee has warned that high oil prices triggered by the Iran conflict could foster a “stagflationary recession” — a scenario where consumption contracts while inflation rises, leaving the Fed with no good policy options.
The Stagflation Risk Investors Should Watch
The most concerning scenario for investors is stagflation — a combination of slowing economic growth and persistent inflation that historically punishes both stocks and bonds simultaneously. The latest PMI data presents a troubling picture: the services employment index plummeted to 45.2% in March, the lowest level since late 2023, yet the new orders index surged to a two-year high of 60.6%. This contradictory mix of cooling employment and resilient demand makes the Fed's policy path extraordinarily difficult to navigate.
A panel of economists surveyed by the Wall Street Journal now forecasts only one Fed rate cut in 2026, down from two, citing higher expected inflation and an unchanged unemployment outlook. If today's PPI confirms the inflation reacceleration trend, that single cut may also be at risk. The probability of any rate cut in 2026 has already fallen to approximately 60% in futures markets, down from near-certainty at the start of the year.
Investment Implications
Investors should consider several key implications of today's PPI release. A reading at or above the 4.6% forecast would likely weigh on rate-sensitive sectors including real estate, utilities, and long-duration growth stocks. Energy sector holdings may benefit from continued oil price strength, though geopolitical risk cuts both ways. Commodities broadly — particularly gold, which has shown mixed signals amid the conflict — may see renewed interest as an inflation hedge. Fixed income investors should brace for potential yield increases if the data reinforces the higher-for-longer rate narrative. The report drops at 8:30 AM ET; expect elevated market volatility in the opening hour of trading.
Disclaimer: This article is for informational purposes only and should not be considered financial advice. Market conditions can change rapidly, and past performance does not guarantee future results. Always conduct your own research and consider consulting with a qualified financial advisor before making investment decisions.