



Photo: Pexels.
Energy Market Overview
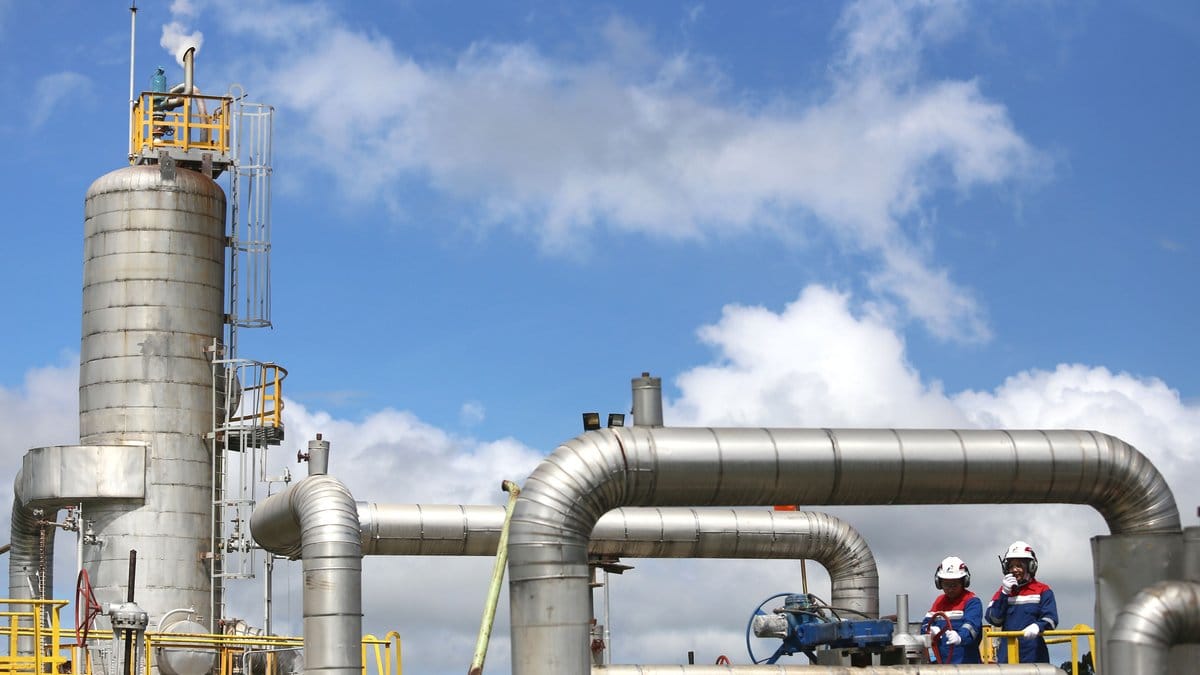
Energy markets are ending the week with a sharp divide between geopolitical strength in crude oil, more restrained U.S. natural gas pricing, and renewed policy pressure on clean-energy developers. At 6:32 a.m. GMT on July 17, Brent crude traded at $84.30 per barrel and West Texas Intermediate at $79.11, according to Reuters. Both benchmarks had gained nearly 12% during the week as renewed U.S.-Iran hostilities, constrained Strait of Hormuz traffic, and threats to Red Sea export routes rebuilt a substantial risk premium.
Natural gas presents a different setup. The latest daily Henry Hub reading was near $2.83 per million British thermal units on July 15, while the U.S. Energy Information Administration expects the 2026 average to remain close to $3.70 as record domestic production helps satisfy rising power-sector and export demand. Storage is comfortable but not excessive: EIA reported 3,024 billion cubic feet in Lower 48 inventories for the week ending July 10, 181 Bcf above the five-year average but 21 Bcf below last year.
Bloomberg reported that IEA Executive Director Fatih Birol sees markets facing “big uncertainty” because Hormuz disruptions threaten oil, gas, fertilizer, and other cargoes. The market is rewarding near-term supply security while still pricing a later normalization.
Oil Market Analysis
The oil rally is being driven more by logistics and security than by a straightforward acceleration in consumption. The IEA’s July Oil Market Report estimates that global supply rebounded by 4.1 million barrels per day in June to 98.8 million bpd as some Hormuz flows recovered. Even after that improvement, output remained 9.4 million bpd below prewar levels. Global observed inventories increased by 21 million barrels, but the composition mattered: OECD stocks fell by 62 million barrels, partly reflecting government stock releases, while oil held on water rose by 117 million barrels. That pattern signals that barrels may exist in the system without being in the locations or forms buyers need most.
Demand forecasts also diverge. The IEA expects global oil demand to decline by 1.0 million bpd in 2026 before rebounding by 2.0 million bpd in 2027. As reported by Reuters, OPEC cut expected 2026 demand growth to 780,000 bpd while raising its 2027 forecast to 1.94 million bpd. OPEC+ production averaged 36.28 million bpd in June as Gulf output recovered.
If shipping lanes stabilize, delayed cargoes could move the market quickly toward inventory rebuilding. EIA projects U.S. crude production at 13.8 million bpd in 2026 and Brent near $82, with greater inventory pressure later in 2026 and 2027. Continued attacks, however, could keep refiners bidding for reliable Atlantic Basin barrels.
Investment implications: Integrated majors and low-cost upstream producers retain the strongest near-term earnings leverage, but investors should distinguish durable free-cash-flow improvement from a temporary geopolitical windfall. Companies with conservative balance sheets, flexible capital returns, and limited dependence on a single export route may hold up better if crude volatility reverses. Refiners and transport operators face a more mixed outlook because elevated feedstock, insurance, and freight costs can offset stronger product margins.
Natural Gas & LNG
U.S. natural gas is supported by LNG demand but moderated by strong production and above-normal storage. EIA reported a 41 Bcf weekly injection, lifting working gas to 3,024 Bcf. The cushion tempers prices while leaving them responsive to heat, LNG feedgas demand, and production outages.
The global LNG picture is tighter. EIA data show worldwide LNG trade rose 5.4% to a record 56.3 Bcf per day in 2025. U.S. exports jumped 26% to 15.1 Bcf per day and are forecast to reach 17.4 Bcf per day in 2026 and 18.6 Bcf per day in 2027. The United States supplied 26% of global LNG exports last year, reinforcing the commercial importance of new liquefaction capacity and reliable pipeline connections. Meanwhile, disrupted Qatari flows through Hormuz have forced Asian and European buyers to compete more actively for flexible cargoes, even as European inventories require rebuilding.
Investment implications: LNG exporters, pipeline operators, and efficient gas producers benefit from rising export capacity, but Henry Hub upside may remain capped when record supply and comfortable storage offset demand growth. Investors should monitor liquefaction start-up execution, contract coverage, basis exposure, and pipeline constraints rather than treating all gas-linked equities as equally sensitive to international LNG prices.
Renewable Energy & Transition
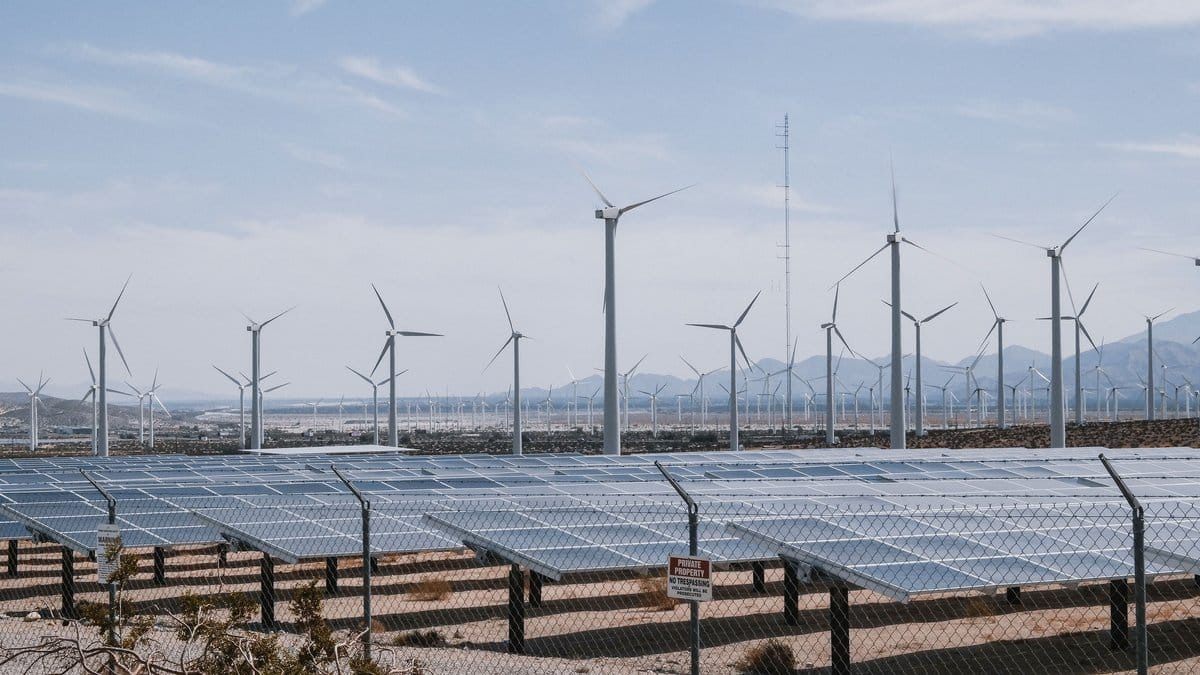
Photo: Pexels.
The renewable-energy sector is balancing powerful electricity-demand growth against a more difficult U.S. policy and financing environment. A Reuters analysis noted that new federal legislation accelerated the phase-out of wind and solar tax credits. That change may increase project costs, narrow developer margins, and favor companies with strong balance sheets, secured interconnection positions, and projects already far enough along to preserve incentives.
Demand fundamentals remain constructive. Solar has led new U.S. power capacity since 2020, while wind remains a major utility-scale addition. EIA expects wind to provide about 11% of U.S. generation in 2026 and solar 8%. Data centers, artificial intelligence, manufacturing, and electrification favor resources that can be deployed quickly, preserving the strategic value of renewables, storage, and grid upgrades.
Investment implications: The transition trade is becoming more selective. Equipment suppliers and developers with contracted backlogs, domestic manufacturing advantages, disciplined financing, and exposure to transmission or grid reliability may outperform highly leveraged pure-play developers. Policy risk can create volatility, but electricity scarcity and load growth still provide a long-duration demand case for well-capitalized renewable and grid businesses.
Energy Stocks & Outlook
Energy equities reflected the commodity split through the July 16 close. The Energy Select Sector SPDR Fund gained 3.5% from July 10, while Exxon Mobil rose 5.1%, Chevron advanced 4.2%, and ConocoPhillips added 3.5%. Gas-focused EQT increased 1.1%, and LNG exporter Cheniere Energy was nearly unchanged with a 0.1% gain. The renewable and electrification group was less uniform: NextEra Energy rose 1.6%, but First Solar fell 7.0% and GE Vernova declined 5.1% over the same period.
The near-term outlook favors secure oil and LNG supply, but normalization could quickly rebuild inventories. Key signals include Brent spreads, Hormuz tanker traffic, U.S. gas output, LNG feedgas volumes, tax-credit implementation, and utility capital plans. Diversified exposure across conventional producers, gas infrastructure, grid equipment, and renewable assets may reduce dependence on one outcome.
Sources
U.S. Energy Information Administration, Short-Term Energy Outlook; International Energy Agency, July 2026 Oil Market Report; OPEC July outlook reported by Reuters; Reuters oil-market coverage; and Bloomberg’s interview with the IEA executive director.
Disclaimer: This analysis is for informational and educational purposes only and should not be considered financial advice. Energy sector investments carry significant commodity price volatility and geopolitical risks. Always conduct your own research and consult with a qualified financial advisor before making investment decisions.