

Markets in Turmoil: Iran War Escalation Sends Stocks Sliding for Fourth Consecutive Week
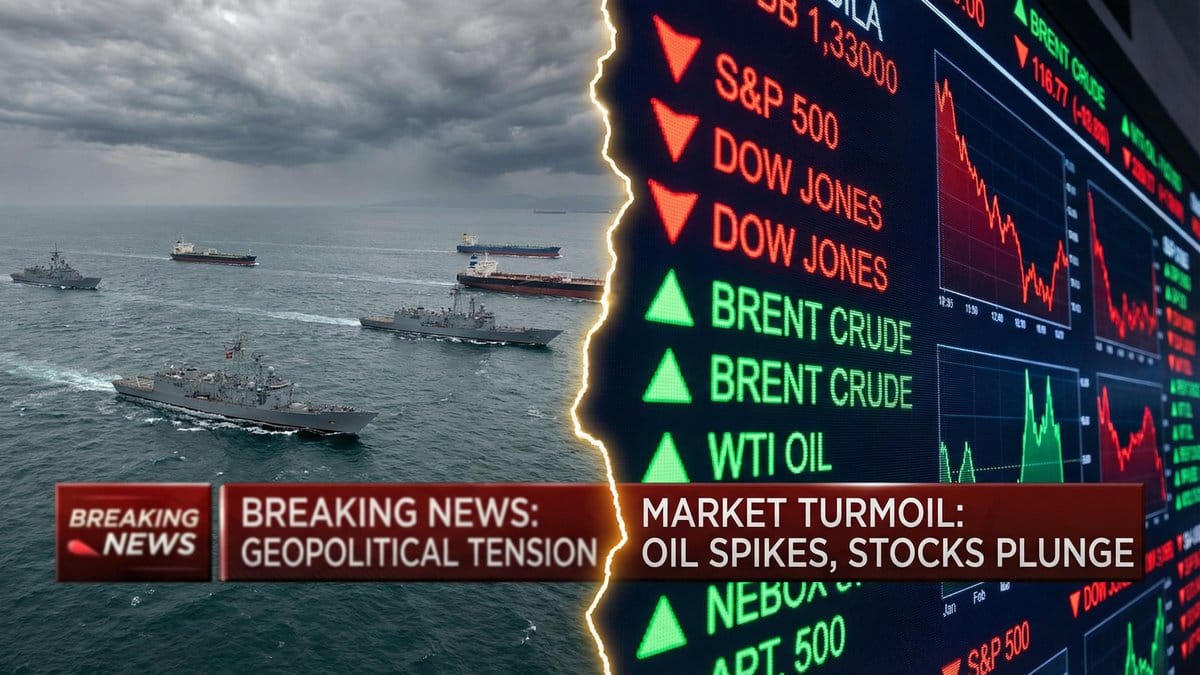
U.S. equity markets extended their losing streak on Monday, March 23, 2026, as the ongoing Iran war and President Trump's 48-hour ultimatum to reopen the Strait of Hormuz sent shockwaves through global financial markets. The S&P 500, which closed Friday at 6,506.48, opened sharply lower as oil prices surged above $113 per barrel and investors fled risk assets in favor of cash and short-term Treasuries.
The selloff marks the fourth consecutive week of losses for major U.S. indices, with the S&P 500 now down 7.1% from its January all-time high of 7,002. The index has broken decisively below its 200-day moving average — a critical technical level — and the Russell 2000 has officially entered correction territory, while the Dow Jones Industrial Average and Nasdaq stand on the doorstep of the same threshold.

The Five Most Significant Market-Moving Events Today
1. Trump's 48-Hour Hormuz Ultimatum Expires Tonight
President Trump issued a 48-hour deadline for Iran to fully reopen the Strait of Hormuz, set to expire at 7:44 PM New York time tonight. Trump threatened to destroy Iran's power infrastructure if the deadline is not met. In response, Iran threatened to target seawater desalination plants across the Gulf region — a move that could force the evacuation of cities like Riyadh, home to 8 million people, within a week. The International Energy Agency reported that at least 40 oil and gas facilities across the Middle East have been damaged in the conflict, with the cumulative damage exceeding the energy crises of 1974 and 2022 combined.
2. Oil Surges Above $113, Brent Crude Hits New War-Era Highs
Brent crude oil surged above $113 per barrel in early trading, with WTI close behind. Iraq's declaration of force majeure on all foreign-operated oil fields on Friday further broadened the supply disruption, confirming that the Hormuz crisis is not contained to Iranian waters. Shell's Pearl gas facility in Qatar — one of the world's largest — will be offline for at least a year, the company confirmed. The energy shock has now surpassed the severity of both the 1974 Arab oil embargo and the 2022 Russia-Ukraine supply crisis.
3. Fed's Hawkish Hold Adds Stagflation Fears to the Mix
Last week's Federal Reserve meeting delivered a “hawkish hold,” keeping rates steady at 3.5–3.75% while revising inflation forecasts upward and cutting growth projections — a textbook stagflation signal. Macquarie now expects the Fed's next move to be a rate hike rather than a cut, pushed to the first half of 2027. With oil as the primary transmission mechanism for inflation, the Fed's hands remain tied even as economic growth slows.
4. Global Markets in Broad Selloff
The damage was not confined to U.S. shores. The Stoxx Europe 600 fell 2.27%, officially entering correction territory at roughly 12% below its recent high. In Asia, South Korea's KOSPI plunged 6.49% and Japan's Nikkei 225 fell 3.48%. Even gold — traditionally a safe haven — declined 6.67%, now down 20% from its recent high, as investors liquidated positions to meet margin calls and raise cash. The selling has broadened beyond mega-cap technology stocks, with consumer names including Home Depot, Domino's, and McCormick hitting 52-week lows.
5. Private Credit Stress Signals Emerging
A new fault line emerged in financial markets as the Stone Ridge Alternative Lending Risk Premium Fund (LENDX), a $2.4 billion interval fund, announced it would only honor 11% of redemption requests — implying investors tendered at least 45% of outstanding shares for withdrawal. The fund's loan portfolio has been written down by 15%, and the panic signals growing investor anxiety about private credit exposure to AI-disrupted sectors and consumer lending platforms including Affirm, Upstart, and LendingClub.
Major Index Performance
The following table summarizes the performance of major U.S. indices heading into today's session, based on Friday's close and Monday's premarket activity:
| Index | Friday Close | Week Change | YTD Change | From ATH |
|---|---|---|---|---|
| S&P 500 | 6,506.48 | -1.51% | -7.1% | -7.1% (ATH: 7,002) |
| Dow Jones | 45,577.47 | -0.96% | Correction Zone | Near correction |
| Nasdaq | 21,647.61 | -2.01% | Near correction | Near correction |
| Russell 2000 | N/A | Declined | In correction | Official correction |
International Market Developments
The Iran war has triggered a synchronized global selloff with few historical precedents outside of major geopolitical crises. European markets are now in official correction territory, with the Stoxx Europe 600 down approximately 12% from its recent high. Asian markets bore some of the heaviest losses, with South Korea's KOSPI falling 6.49% — reflecting that nation's heavy dependence on Middle Eastern energy imports — and Japan's Nikkei 225 declining 3.48%.
The Strait of Hormuz remains effectively closed to most international shipping, with the exception of vessels from countries that have negotiated deals with Iran. Japan, India, and Pakistan have successfully sailed freighters through the strait. The closure has disrupted global supply chains far beyond oil, with the Iran war now crippling Asia's supplies of fertilizer and helium — threatening agricultural production and semiconductor manufacturing simultaneously.
Investment Implications
The current market environment presents a complex challenge for investors. Historically, S&P 500 breaks below the 200-day moving average have been followed by higher prices 87% of the time six months later (average gain: +9%) and 85% of the time twelve months later (average gain: +14%). However, the average maximum drawdown during those recovery periods was approximately 16.5%, suggesting that from current levels, a full washout could take the S&P 500 into the 5,800–6,000 range before a durable bottom forms.
The path to recovery requires either a sustained decline in oil prices or a credible de-escalation in the Middle East conflict. Neither appears imminent. HSBC notes that markets are currently “pricing a recessionary outcome,” and the broadening of selling pressure into consumer staples and defensive names suggests the damage is no longer confined to rate-sensitive growth stocks.
For investors navigating this environment, a defensive posture is warranted. Quality companies with strong balance sheets, pricing power, and limited energy cost exposure represent the most resilient positions. Cash reserves provide optionality to accumulate at pre-defined support levels (S&P 500: 6,400, then 6,300). Every bounce should be treated as suspect until the VIX sustains below 20 and oil prices find a ceiling.
Disclaimer: This article is for informational purposes only and should not be considered financial advice. Market conditions can change rapidly, and past performance does not guarantee future results. Always conduct your own research and consider consulting with a qualified financial advisor before making investment decisions.